· 10 min read
Cannabis Lab 101: Measurement Uncertainty and Why Two Labs Can Both Be Right
I spent years watching growers panic when two labs returned different THC numbers on the same batch. Most of the time, both labs were correct. This article explains measurement uncertainty in plain English: what it is, how it is calculated, what ISO 17025 requires, and how to read a result that comes with a ± attached.
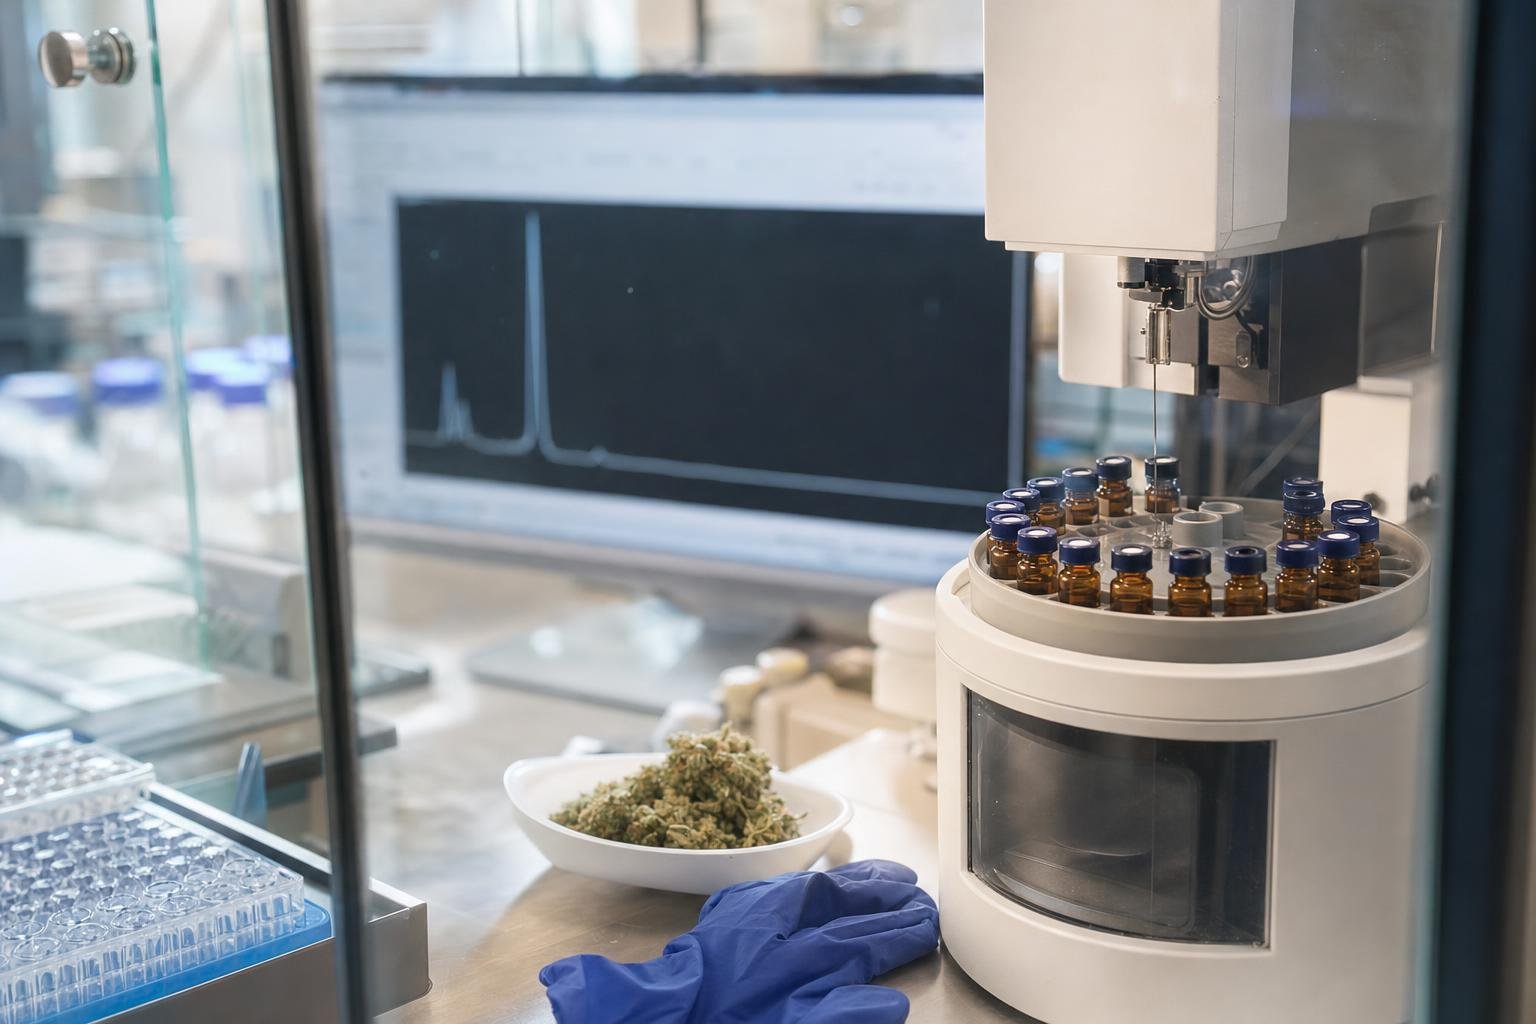
You send the same batch of flower to two accredited labs. Lab A reports 22.4% total THC. Lab B reports 20.6% total THC. Your phone rings before you have finished reading the emails. The grower wants to know which lab is lying. The honest answer, which I have given more times than I can count, is that neither of them necessarily is. Both results can be correct once you understand measurement uncertainty, and understanding it is the difference between a productive conversation and an expensive retest that proves nothing.
Whether you are a bench technician building your first uncertainty budget, a lab director preparing for an ISO 17025 audit, or a grower trying to make sense of a ± on your certificate of analysis, this article gives you the vocabulary, the calculation logic, and the regulatory citations you need to work with measurement uncertainty rather than around it.
This article covers:
- What measurement uncertainty actually means and what it does not mean
- The step-by-step logic for building an uncertainty estimate
- What ISO/IEC 17025:2017 clause 7.6 requires and when MU must appear on a report
- The federal hemp rule that mandates MU reporting by name
- Why a gap between two lab results is not automatically a problem
- How to read a conformity statement when a result sits close to a limit
Step 1: Understand what measurement uncertainty actually is
Measurement uncertainty (MU) is the parameter associated with a measurement result that characterizes the dispersion of values reasonably attributable to the measurand. The measurand (the specific quantity being measured, such as delta-9-THC concentration in a flower matrix on a dry-weight basis) is never known with perfect precision. Every step between the sample arriving at the lab and the number appearing on the report introduces some spread in possible values.
MU is not a confession that the result is wrong. It is not an error bar in the colloquial sense of “we messed up somewhere.” It describes the confidence context around a reported result. A result reported as 22.4% ± 1.2% (at a stated coverage level) means the lab is telling you that, given everything they know about their method’s performance, the true value is very likely to fall somewhere in that interval.
The ± is not a hedge; it is a quantified statement of how well the lab knows what it measured.
What MU is not: it is not the same as bias (systematic deviation of results from the true value), though bias can be one input into an uncertainty estimate. It is not the same as repeatability (variation across replicate measurements within a single run), though repeatability is also an input. A lab that reports only within-run repeatability as its uncertainty is almost certainly underestimating the real spread.
Step 2: Walk through how an uncertainty budget is built
The NIST SOP 29 process gives the clearest English-language walkthrough of how to construct a defensible uncertainty estimate. The logic runs in sequence:
- Specify the measurand and the measurement process. Write down exactly what you are measuring and every step of the procedure that touches the sample.
- Identify uncertainty components. For cannabis potency, contributions can arise from sampling, sample homogenization, extraction, calibration standard purity and preparation, instrument response, weighing, dilution, repeatability across runs, reproducibility across days or analysts, and environmental or operator effects. This list is method-specific; your SOP (standard operating procedure) determines which components are relevant.
- Quantify each component. Some components are estimated from repeated measurements (Type A evaluation). Others are estimated from certificates, published data, or engineering judgment (Type B evaluation).
- Convert to standard uncertainties. Each component is expressed as a standard deviation or its equivalent so they can be combined mathematically.
- Combine them. The combined standard uncertainty is calculated by combining the individual standard uncertainties, typically by taking the square root of the sum of their squares when the components are independent.
- Apply a coverage factor. An expanded uncertainty (the combined standard uncertainty multiplied by a coverage factor k) is reported with a stated confidence level. A k of 2 corresponds roughly to 95% confidence for a normal distribution.
Health Canada guidance makes an important practical point: labs should estimate MU for each analytical method rather than assuming one uncertainty value applies to every analyte, matrix, concentration range, and instrument. A method validated for flower at 20% THC does not automatically carry the same uncertainty when applied to a concentrate at 80% THC.
Note: When a test method makes a rigorous bottom-up uncertainty evaluation difficult, ISO guidance allows a technically justified alternative approach based on method performance data and available evidence, such as using interlaboratory comparison data or proficiency testing results to estimate reproducibility.
For more on the method validation work that feeds into an uncertainty budget, see the Cannabis Lab 101 validation article and the technical overview of potency determination.
Step 3: Know the reporting requirements by jurisdiction
ISO/IEC 17025:2017 addresses measurement uncertainty in clause 7.6. The standard requires laboratories performing testing to evaluate measurement uncertainty, or estimate it when rigorous evaluation is precluded. When MU affects compliance with a specification limit, that is one of the conditions under clause 7.8.3.1(c) for when MU must be included in test reports.
Accreditation guidance adds that where MU affects compliance with a specification limit, the report should explicitly address it, and a laboratory’s statement of conformity should explain how MU was considered when the result is compared with a regulatory or specification limit. If MU is not printed directly on the report, the report should at minimum state that MU is available on request.
For federally regulated hemp, MU reporting is not optional. 7 CFR § 990.25(f) requires that measurement uncertainty must be estimated and reported with total delta-9-THC test results. USDA AMS guidance specifies that MU should appear as a ± value in the same unit as the applicable THC threshold, with significant figures and rounding appropriate to the result. USDA also identifies ISO/IEC 17025 as the relevant general standard for hemp testing laboratories.
State adult-use and medical cannabis programs vary. New York’s Cannabis Laboratory Quality System Standard is one of the more explicit examples: it permits a lab to report a cannabinoid result above 100% as 100% when the excess falls within the lab’s calculated analytical uncertainty, provided a qualifying statement or the calculated result accompanies the report. That rule only makes sense if MU is already part of the lab’s documented quality system. For other states, check the primary source: your state cannabis regulator’s laboratory standards page, not a summary.
Note: Health Canada guidance recommends reporting MU and the limit of quantification with consistent, appropriate significant digits, and rounding reported results so they contain only the appropriate number of significant digits. Canadian requirements apply to licensed producers in Canada; US labs should verify their own state and federal obligations.
For a broader look at what ISO 17025 auditors actually check, see Cannabis Testing Lab Certification: How to Prepare for ISO 17025 Audits.
Step 4: Apply MU logic to a real inter-lab discrepancy
Back to the opening scenario. Lab A reports 22.4% THC. Lab B reports 20.6% THC. The gap is 1.8 percentage points. Is that a problem?
You cannot answer that question without the uncertainty estimates from both labs. Here is the reasoning:
A numerical difference between two THC results cannot be judged as meaningful without the laboratories’ MU estimates, units, rounding rules, methods, and sample identity. If Lab A’s expanded uncertainty is ± 1.5% and Lab B’s is ± 1.3%, the intervals overlap substantially. The results are statistically consistent with each other. Neither lab needs to explain itself.
The defensible way to assess a two-lab difference is to compare the observed difference with the combined uncertainty of both measurements, using the labs’ stated coverage conventions and, critically, comparable sampling and preparation procedures.
That last clause matters. Sample heterogeneity can make two aliquots from the same batch differ before either laboratory measures them. If Lab A received a different portion of the batch than Lab B, or if the batch was not homogeneous, the difference you are seeing may be real variation in the product, not analytical disagreement. Laboratory-to-laboratory comparisons should always distinguish sampling variation from analytical variation. This is why proficiency testing uses homogenized reference materials: to remove sampling variation from the comparison.
A result of 22.4% and a result of 22% may represent the same underlying measurement reported to different decimal places, and rounding should occur only at the final reporting stage to match the method’s specified reporting precision.
Two labs can both be right because their uncertainty intervals overlap, and a result is not a single point: it is a range with a stated confidence level attached.
I suggest labs take this a step further when a client calls about a discrepancy: ask for the other lab’s full certificate of analysis, including the method reference, the calibration standard used, whether the result is on a dry-weight or as-received basis, and the stated uncertainty or the lab’s documented MU for that method. Most apparent disagreements dissolve when you align the units and the coverage conventions. The ones that do not dissolve are worth investigating, and they usually point to a sample preparation difference or a calibration standard traceability issue rather than fraud.
Note: For potency specifically, the choice of analytical platform (HPLC vs. GC, for example) and whether THCA is decarboxylated before or after measurement can produce real differences in reported total THC that are not uncertainty at all. They are method differences. See the cannabinoid separation methods article for the technical details. Always confirm that both labs used the same calculation for total THC before attributing a gap to MU.
Quick answers
Why do two cannabis labs give different THC results on the same sample? Two labs can report different THC values because every measurement carries uncertainty from the complete analytical process: sample preparation, extraction, calibration, and instrument response. A numerical gap between two results is only meaningful if it is larger than the combined uncertainty of both measurements. Sample heterogeneity can also cause two aliquots from the same batch to differ before either lab touches them.
Does ISO 17025 require labs to print measurement uncertainty on every cannabis test report? Not automatically on every report. ISO/IEC 17025:2017 clause 7.6 requires laboratories performing testing to evaluate measurement uncertainty, or estimate it when rigorous evaluation is precluded. Where MU affects compliance with a specification limit, accreditation guidance states the report should explicitly address it; otherwise, the lab may make MU available on request.
Is there a federal rule requiring cannabis labs to report measurement uncertainty? Yes, for federally regulated hemp. Under 7 CFR § 990.25(f), measurement uncertainty must be estimated and reported with total delta-9-THC test results. USDA guidance specifies that MU should appear as a ± value in the same unit as the applicable THC threshold. State-licensed adult-use and medical cannabis programs have their own rules, which vary by state.
What is a coverage factor and why does it appear on my test report? A coverage factor (commonly written as k) is a multiplier applied to the standard uncertainty to produce an expanded uncertainty at a stated confidence level. A k of 2 corresponds roughly to 95% confidence for a normal distribution, meaning the true value is expected to fall within the reported ± range about 95 times out of 100. NIST SOP 29 describes the process for selecting and applying coverage factors.
Can a lab report a cannabinoid result above 100%? In most programs that would be a flag, but New York’s Cannabis Laboratory Quality System Standard explicitly permits a lab to report a result above 100% as 100% when the excess falls within the lab’s calculated analytical uncertainty, provided a qualifying statement or the calculated result accompanies the report. This is a concrete example of a state program building MU directly into its reporting rules.
What sources of uncertainty matter most in cannabis potency testing? The largest contributors typically come from sample homogenization, extraction efficiency, calibration standard purity, and instrument response variation, though the relative size of each depends on the specific method, matrix, and concentration range. A defensible uncertainty budget accounts for all principal contributions rather than repeatability alone within a single run. Health Canada guidance recommends that labs estimate MU separately for each analytical method rather than applying one number across all analytes and matrices.
Sources
- 7 CFR § 990.25, eCFR
- USDA AMS Hemp Laboratory Testing Guidelines
- Raad voor Accreditatie, Explanation of EN ISO/IEC 17025
- NIST SOP 29, Assignment of Uncertainty
- Health Canada, Validating Analytical Methods for Cannabis Testing
- ISO TC34/SC9 WG2 Presentation on ISO 19036 and Measurement Uncertainty
- New York Cannabis Laboratory Quality System Standard
- NATA ISO/IEC 17025 Standard Application Document}
FAQ
Frequently asked
- why do two cannabis labs give different THC results on the same sample
- Two labs can report different THC values because every measurement carries uncertainty from the complete analytical process: sample preparation, extraction, calibration, and instrument response. A numerical gap between two results is only meaningful if it is larger than the combined uncertainty of both measurements. Sample heterogeneity can also cause two aliquots from the same batch to differ before either lab touches them.
- does ISO 17025 require labs to print measurement uncertainty on every cannabis test report
- Not automatically on every report. ISO/IEC 17025:2017 clause 7.6 requires laboratories performing testing to evaluate measurement uncertainty, or estimate it when rigorous evaluation is precluded. Where MU affects compliance with a specification limit, accreditation guidance states the report should explicitly address it; otherwise, the lab may make MU available on request.
- is there a federal rule requiring cannabis labs to report measurement uncertainty
- Yes, for federally regulated hemp. Under 7 CFR § 990.25(f), measurement uncertainty must be estimated and reported with total delta-9-THC test results. USDA guidance specifies that MU should appear as a ± value in the same unit as the applicable THC threshold. State-licensed adult-use and medical cannabis programs have their own rules, which vary by state.
- what is a coverage factor and why does it appear on my test report
- A coverage factor (commonly written as k) is a multiplier applied to the standard uncertainty to produce an expanded uncertainty at a stated confidence level. A k of 2 corresponds roughly to 95% confidence for a normal distribution, meaning the true value is expected to fall within the reported ± range about 95 times out of 100. NIST SOP 29 describes the process for selecting and applying coverage factors.
- can a lab report a cannabinoid result above 100 percent
- In most programs that would be a flag, but New York's Cannabis Laboratory Quality System Standard explicitly permits a lab to report a result above 100% as 100% when the excess falls within the lab's calculated analytical uncertainty, provided a qualifying statement or the calculated result accompanies the report. This is a concrete example of a state program building MU directly into its reporting rules.
- what sources of uncertainty matter most in cannabis potency testing
- The largest contributors typically come from sample homogenization, extraction efficiency, calibration standard purity, and instrument response variation, though the relative size of each depends on the specific method, matrix, and concentration range. A defensible uncertainty budget accounts for all principal contributions rather than repeatability alone within a single run. Health Canada guidance recommends that labs estimate MU separately for each analytical method rather than applying one number across all analytes and matrices.
Related guides
All guides- 01
Cannabis Lab 101: Cannabis Edibles Testing Cost — Why Infused Products Cost More to Test
I spent four years running potency assays on everything from flower to fudge, and infused products always took longer and cost more. Here is exactly why — matrix effects, homogeneity requirements, and the extra sample prep no one explains — plus real prices from published lab menus.
- 02
Cannabis Lab 101: Writing SOPs That Survive an Audit
I spent four years watching labs fail accreditation audits over paperwork that should have been airtight. This guide walks through the structure of a defensible SOP, version control that actually works, training records auditors accept, and the recurring findings that accreditation bodies flag most often.
- 03
Cannabis Lab 101: Pesticide Testing (LC-MS/MS vs GC-MS/MS) and Why You Need Both
I spent years running pesticide panels on cannabis flower and learned fast that no single instrument platform covers the full analyte list. This guide walks through QuEChERS extraction, matrix effects, why GC-MS/MS handles what LC-MS/MS cannot, and what California's §15719 actually requires your LOQ to be.
Need this tested?
Compare labs that run these assays and get quotes in one go — no account, no fee.