· 11 min read
Cannabis Lab 101: LOD and LOQ in Cannabis Testing and What 'Not Detected' on a COA Actually Means
I break down what a lab actually means when it prints 'ND' on a certificate of analysis, why that result is only meaningful relative to a validated LOD and LOQ, how cannabis labs establish those limits during method validation, and the compliance risk when a lab's LOQ sits above a state pesticide action level.
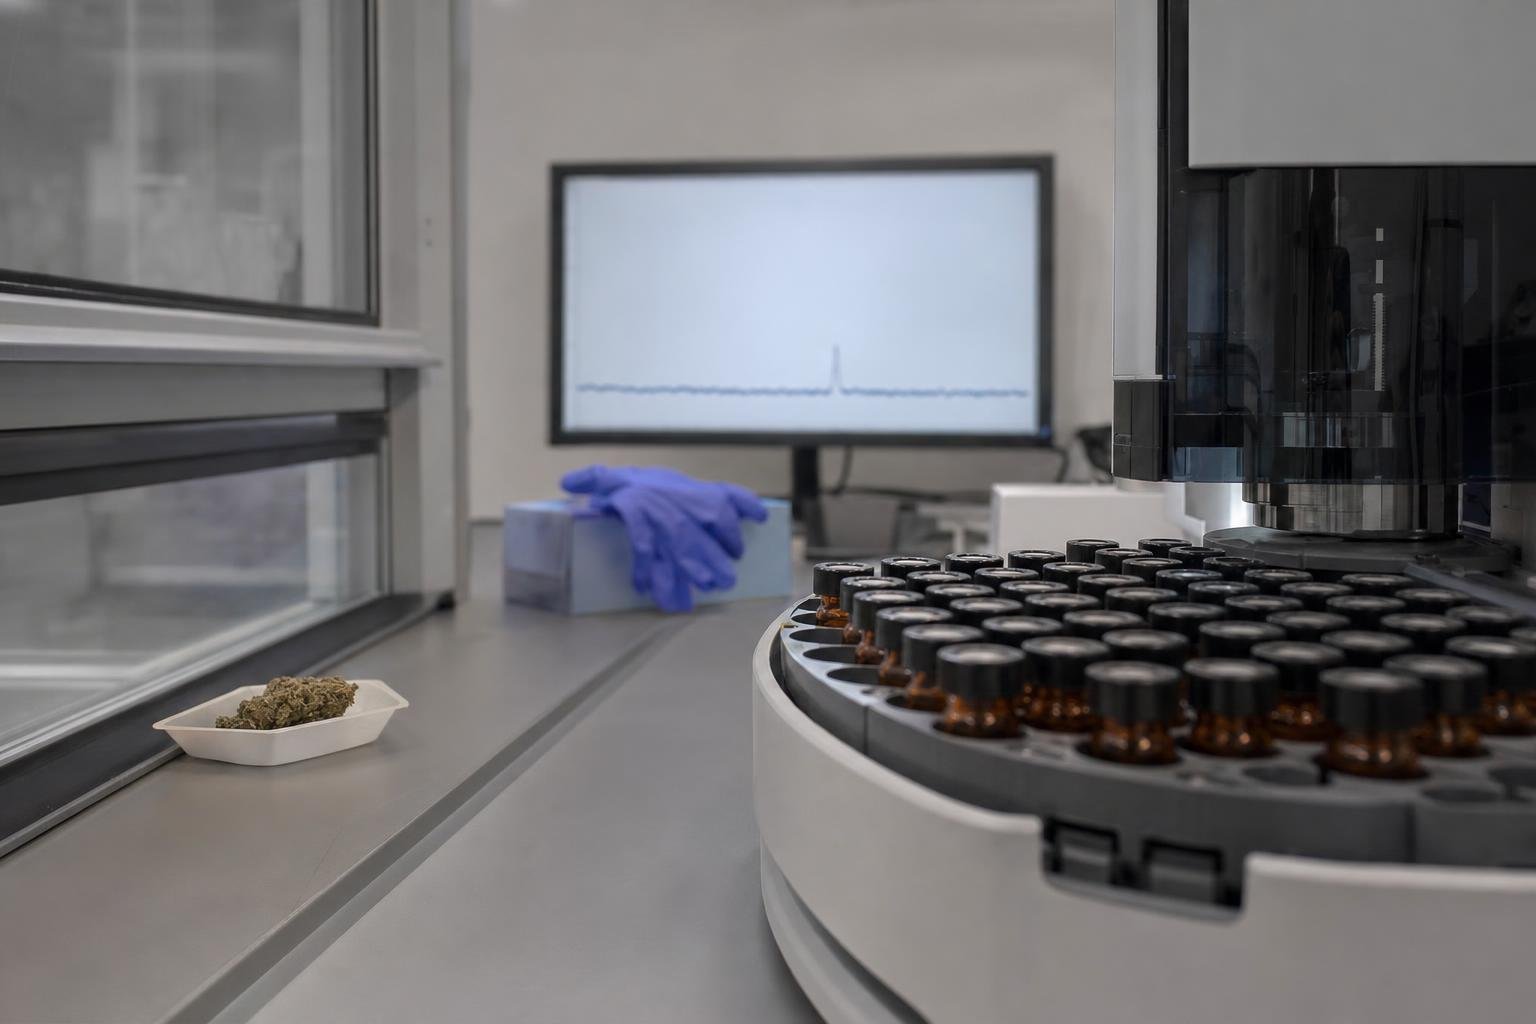
When a cannabis lab prints ‘ND’ on a certificate of analysis, most people read it as ‘clean.’ What it actually means is ‘below the threshold this method can reliably detect,’ and those two things are not the same. Understanding the difference between a limit of detection (LOD) and a limit of quantitation (LOQ), and knowing how they interact with state action limits, is one of the most practically useful skills a lab analyst, quality manager, or cultivator can develop.
Whether you are a bench analyst running your first pesticide screen, a lab director writing a validation protocol, or a grower trying to make sense of a COA before a product ships, this article gives you the definitions, the math, the regulatory citations, and the red flags to look for. You will not need anything else open.
Here is what this article covers:
- The statistical definitions of LOD and LOQ and why they are not interchangeable
- The three main approaches cannabis labs use to establish LOD and LOQ during method validation
- How state rules tie LOQ to action limits, with specific examples from California, Michigan, and Vermont
- How to read a COA critically when a result says ND
- The compliance risk when a lab’s LOQ is too high
Step 1: Understand what LOD and LOQ actually define
LOD and LOQ are performance characteristics of an analytical method, not properties of the analyte itself. That distinction matters because the same pesticide can have a different LOD depending on the instrument, the extraction procedure, and the matrix being tested.
California’s cannabis regulations define the limit of detection as the lowest quantity of a substance distinguishable from its absence within a stated confidence limit. New York’s Cannabis Laboratory Quality System Standard is more specific: it defines LOD as the statistically calculated minimum concentration measurable with 99% confidence that the value is greater than zero, and notes that LOD is also called the method detection limit (MDL). Michigan’s technical guidance aligns with that, defining the detection limit as the lowest concentration statistically different from a blank at 99% confidence.
LOQ is a higher bar. Michigan defines it as the minimum concentration or mass of an analyte in a target matrix that can be reported as a quantitative result. The phrase ‘in a target matrix’ is doing real work there: flower, concentrate, and edible matrices all suppress or enhance signal differently, so a lab that validates LOQ only in solvent may be reporting a number that does not reflect real-world performance.
The key distinction is this: a lab can detect a signal between the LOD and the LOQ, but it cannot assign that signal a reliable concentration. Results in that zone are sometimes reported as ‘detected, not quantifiable,’ sometimes collapsed into ND, and sometimes reported with a less-than qualifier. What the lab does with that zone should be documented in its standard operating procedure.
Note: For potency analytes like cannabinoids, LOD and LOQ matter less for pass/fail compliance because the action logic is ‘does the label claim match the result,’ not ‘is the analyte present at all.’ The LOD/LOQ conversation is sharpest for pesticides, mycotoxins, and residual solvents, where the regulatory question is whether a contaminant is present above a threshold. See the detailed guide on cannabis pesticide testing for more on that panel.
Step 2: Know the three validation approaches labs use to establish LOD and LOQ
There is no single universal calculation method for LOD and LOQ in cannabis testing, which is part of why two labs can report different ND thresholds for the same analyte. California’s proposed pesticide testing text explicitly lists multiple permitted approaches, and understanding them helps you evaluate whether a lab’s validation is credible.
Signal-to-noise (S/N) ratio. For chromatographic analyses, California requires a minimum 3:1 signal-to-noise ratio for LOD, verified by visual inspection of the chromatogram. For LOQ, the corresponding criterion is a minimum 10:1 signal-to-noise ratio. This approach is intuitive for analysts reading a trace: you are asking whether the analyte peak is meaningfully taller than the background noise. The limitation is that S/N estimates can be subjective unless the software calculates them consistently.
Regression-based calculation. California’s proposed text also permits calculating LOD as 3.3 times the standard deviation of response divided by the calibration-curve slope, using a minimum of seven spiked blank samples. Written out: LOD = 3.3 × (σ / S), where σ is the standard deviation of the blank or low-level spike responses and S is the slope of the calibration curve. This approach ties the detection limit to both how noisy the method is at low concentrations and how sensitive the calibration is. A steeper slope (more sensitive method) produces a lower LOD for the same noise level.
Spiked blank studies. The seven-replicate spiked blank requirement in California’s proposed text is a practical implementation of the regression approach. You prepare blanks of the target matrix, spike them at a low concentration near the expected LOD, run them through the full method, and calculate the standard deviation of those responses. The matrix matters: a cannabis concentrate spiked at the same nominal concentration as a flower sample will behave differently, which is why Michigan’s guidance ties LOQ explicitly to the target matrix.
The LOD and LOQ calculations are not interchangeable. California assigns the 3:1 S/N criterion to LOD and the 10:1 criterion to LOQ. A lab that reports the same value for both, or that uses a 10:1 criterion for LOD, has either made an error or is using a non-standard convention that should be flagged in a quality audit. For more on what a full method validation looks like, see Cannabis Lab 101: Method Validation.
Note: The regression formula (3.3 × σ/S) is widely used in analytical chemistry and appears in guidance from multiple regulators, but the exact number of replicates and the acceptable matrix preparation can vary by state rule. Always check your state’s current requirement rather than assuming the California number applies.
Step 3: Understand how state action limits and LOQ interact, and where the compliance risk lives
The most dangerous sentence on a COA is an ND result backed by an LOQ that sits above the state action limit for that analyte.
Here is why. If a state sets an action limit of 0.04 µg/g for chlorpyrifos (as Vermont does for that analyte in its action limit guidance), and a lab’s validated LOQ for chlorpyrifos is 0.10 µg/g, then the lab cannot reliably quantify a residue at the regulatory decision point. A sample containing 0.06 µg/g of chlorpyrifos, which would fail Vermont’s limit, could come back ND from that lab because the residue falls below the LOQ. The product ships. The residue was there.
Regulators have addressed this directly. California’s final pesticide testing rules require the LOQ for each listed pesticide to be at or below that pesticide’s action level. California’s final statement of reasons notes that 0.02 µg/g was determined to be the lowest feasible pesticide action level at the time the rule was developed, which gives you a sense of the sensitivity floor the state was working from.
Michigan’s guidance takes a similar position: when no standard method performance requirement specifies an LOQ, the lab’s LOQ must be at most one-half of the published action limit. That half-of-limit rule gives a buffer so the lab can reliably quantify at the action limit itself, not just at the limit.
Vermont’s action limits illustrate how much variation exists within a single jurisdiction. The Vermont guidance lists acephate at 0.1 ppm, chlorpyrifos at 0.04 ppm, myclobutanil at 0.1 ppm, imidacloprid at 5.0 ppm, and bifenthrin at 3.0 ppm. A lab validating a pesticide panel for Vermont needs an LOQ that is fit for the tightest limit on the list, not just the average. One method cannot use a single LOQ for the whole panel if the action limits span two orders of magnitude.
Note: California specifies that residual-pesticide results must be reported on the COA in micrograms per gram (µg/g). Vermont’s guidance presents limits in ppm, mg/kg, or mg/L depending on the parameter and product type. Micrograms per gram and ppm are numerically equivalent for mass/mass comparisons in most cannabis matrices, but always confirm units before comparing a COA result to a regulatory limit.
Step 4: Read a COA critically when a result says ND
A well-formatted COA for a pesticide panel should give you more than a pass/fail flag and a column of ND entries. New York’s COA-reading guidance identifies the panel of analytes as a key element to review, and New York’s laboratory chemistry checklist explicitly links LOQ selection to method, reference standards, and regulatory limits. Those two documents together tell you what a compliant lab is supposed to be doing, and they give you a checklist for evaluating whether a COA reflects that work.
When you receive a COA with ND results, check for these fields:
- Analyte name. Is every analyte your state requires actually on the panel? A missing analyte is not ND, it is untested.
- Result and unit. Confirm the unit matches your state’s reporting requirement.
- LOD and LOQ. Are they listed? If not, ask the lab. A COA that shows only ND with no detection threshold is not giving you the information you need.
- LOQ vs. action limit. For each analyte, is the reported LOQ at or below the state action limit? If the LOQ exceeds the action limit, the ND result does not clear the regulatory bar.
- Analytical method. LC-MS/MS (liquid chromatography coupled to tandem mass spectrometry) and GC-MS/MS (gas chromatography coupled to tandem mass spectrometry) are the standard platforms for multi-residue pesticide panels because of their sensitivity. A method that cannot achieve the required LOQ for a tight action limit is a method problem, not a sample problem.
- Sample matrix. LOD and LOQ are matrix-dependent. A validation run on flower does not automatically transfer to a concentrate or an edible.
An ND result is not portable across laboratories unless both labs use comparable validated methods with comparable reporting thresholds. If a grower sends splits to two labs and gets ND from both, that is reassuring only if both labs have LOQs at or below the relevant action limits. If one lab has a higher LOQ, its ND is a weaker statement. This is not a hypothetical: it is the reason regulators in California and Michigan wrote LOQ-to-action-limit requirements into their rules.
I suggest labs take it a step further and include a column on every pesticide COA that shows the state action limit alongside the LOQ, so the reader can make the comparison without doing the lookup themselves. It costs nothing to add that column and it makes the ND result meaningful at a glance.
Note: For mycotoxins and residual solvents, the same logic applies. If your state has a mycotoxin action limit and the lab’s LOQ for aflatoxin B1 is above that limit, an ND result does not confirm compliance. See why mycotoxin testing in cannabis is critical for more on that panel.
Quick answers
What does ND mean on a cannabis COA? ND means the analyte was not detected above the method’s validated limit of detection, not that the analyte is definitively absent at zero concentration. The result is only as meaningful as the LOD it is tied to: a lab with a high LOD could report ND on a sample that actually contains a residue below that threshold. Always check whether the COA lists the LOD or LOQ alongside the ND result.
What is the difference between LOD and LOQ in cannabis testing? LOD (limit of detection) is the lowest concentration statistically distinguishable from a blank, typically at 99% confidence under Michigan and New York rules. LOQ (limit of quantitation) is the lowest concentration at which the lab can report a reliable quantitative number, and it is always higher than the LOD. An analyte can be detected between the LOD and LOQ but cannot be assigned a trustworthy concentration in that range.
What happens if a lab’s LOQ is higher than a state pesticide action limit? If a lab’s LOQ sits above a state action limit, the lab cannot reliably quantify residues at the regulatory decision point, which creates a compliance blind spot. California addresses this directly by requiring the LOQ for each listed pesticide to be at or below that pesticide’s action level. Michigan takes a similar approach, requiring the LOQ to be at most one-half of the published action limit when no standard method performance requirement specifies otherwise.
How do cannabis labs calculate LOD during method validation? California’s pesticide rules permit at least two approaches: a signal-to-noise ratio of 3:1 for chromatographic analyses, or a regression formula where LOD equals 3.3 times the standard deviation of response divided by the calibration-curve slope, using a minimum of seven spiked blank samples. The choice of approach affects the final number, so two labs running the same analyte can legitimately arrive at different LODs depending on which calculation they used.
Can I compare an ND result from one cannabis lab to an ND result from a different lab? Not directly, because LOD and LOQ are method- and matrix-specific performance characteristics, and two labs using different validated methods will have different detection thresholds. An ND from a lab with a low LOD is a much stronger statement than an ND from a lab with a high LOD. To make a meaningful comparison you need both labs to report their LODs alongside the result.
What fields should I look for on a COA to evaluate an ND result? The most useful fields are the analyte name, result, unit, LOD, LOQ, analytical method, sample matrix, and the applicable regulatory action limit for your state. New York’s laboratory chemistry checklist explicitly links LOQ selection to method, reference standards, and regulatory limits, so a well-formatted COA should make that connection visible. If the COA shows only ND with no LOD or LOQ column, ask the lab for the full method validation summary.
Sources
- California DCC Current Regulations
- California DCC Pesticide Testing Final Text
- California DCC Pesticide Testing Third Modified Text
- California DCC Pesticide Testing Final Statement of Reasons
- California DCC Proposed Pesticide Testing Text (May 2025)
- New York Cannabis Laboratory Quality System Standard
- New York OCM How to Read a COA
- New York OCM Chemistry Checklist v11.2
- Michigan CRA Sampling and Testing Technical Guidance
- Vermont CCB Action Limits and Parameters Guidance
FAQ
Frequently asked
- What does ND mean on a cannabis COA?
- ND means the analyte was not detected above the method's validated limit of detection, not that the analyte is definitively absent at zero concentration. The result is only as meaningful as the LOD it is tied to: a lab with a high LOD could report ND on a sample that actually contains a residue below that threshold. Always check whether the COA lists the LOD or LOQ alongside the ND result.
- What is the difference between LOD and LOQ in cannabis testing?
- LOD (limit of detection) is the lowest concentration statistically distinguishable from a blank, typically at 99% confidence under Michigan and New York rules. LOQ (limit of quantitation) is the lowest concentration at which the lab can report a reliable quantitative number, and it is always higher than the LOD. An analyte can be detected between the LOD and LOQ but cannot be assigned a trustworthy concentration in that range.
- What happens if a lab's LOQ is higher than a state pesticide action limit?
- If a lab's LOQ sits above a state action limit, the lab cannot reliably quantify residues at the regulatory decision point, which creates a compliance blind spot. California addresses this directly by requiring the LOQ for each listed pesticide to be at or below that pesticide's action level. Michigan takes a similar approach, requiring the LOQ to be at most one-half of the published action limit when no standard method performance requirement specifies otherwise.
- How do cannabis labs calculate LOD during method validation?
- California's pesticide rules permit at least two approaches: a signal-to-noise ratio of 3:1 for chromatographic analyses, or a regression formula where LOD equals 3.3 times the standard deviation of response divided by the calibration-curve slope, using a minimum of seven spiked blank samples. The choice of approach affects the final number, so two labs running the same analyte can legitimately arrive at different LODs depending on which calculation they used.
- Can I compare an ND result from one cannabis lab to an ND result from a different lab?
- Not directly, because LOD and LOQ are method- and matrix-specific performance characteristics, and two labs using different validated methods will have different detection thresholds. An ND from a lab with an LOD of 0.005 µg/g is a much stronger statement than an ND from a lab with an LOD of 0.05 µg/g. To make a meaningful comparison you need both labs to report their LODs alongside the result.
- What fields should I look for on a COA to evaluate an ND result?
- The most useful fields are the analyte name, result, unit, LOD, LOQ, analytical method, sample matrix, and the applicable regulatory action limit for your state. New York's laboratory chemistry checklist explicitly links LOQ selection to method, reference standards, and regulatory limits, so a well-formatted COA should make that connection visible. If the COA shows only ND with no LOD or LOQ column, ask the lab for the full method validation summary.
Related guides
All guides- 01
Cannabis Lab 101: Pesticide Testing (LC-MS/MS vs GC-MS/MS) and Why You Need Both
I spent years running pesticide panels on cannabis flower and learned fast that no single instrument platform covers the full analyte list. This guide walks through QuEChERS extraction, matrix effects, why GC-MS/MS handles what LC-MS/MS cannot, and what California's §15719 actually requires your LOQ to be.
- 02
Cannabis Lab 101: Stability Testing, Expiry Dates, and How Labs Set a Shelf Life
I spent years running compliance panels and watched stability testing get treated as an afterthought. This article breaks down real-time vs accelerated studies, what states actually require, how THC degrades over time, and what acceptance criteria your data must hit before a regulator will approve an expiration date.
- 03
Cannabis Lab 101: Foreign Matter and Visual Inspection, the Cheapest Test That Fails the Most Flower
I walk you through the microscopy method, the photos-in-words of what actually fails, and how pass/fail thresholds differ by state, so you can run the inspection correctly, document it defensibly, and understand why a single hair can reject a whole batch.
Need this tested?
Compare labs that run these assays and get quotes in one go — no account, no fee.